Google Analytics counts every visit, including automated ones. Bots, crawlers, and spam referrers inflate your traffic numbers, distort engagement metrics, and make it harder to understand real visitor behavior.
Built-in Google Analytics bot filtering catches some known bots, but many slip through. If your site has this problem, you may see traffic spikes that don't match real interest, or engagement rates that suddenly drop. In our analysis of real websites, about 60% had meaningful bot traffic that Google Analytics didn't filter.
When Page Analytics finds bot traffic it can remove safely, it shows a filter option for that website in the browser extension. Turn it on, and your Page Analytics reports show the same site data with high-confidence bot sessions excluded. Your Google Analytics property stays unchanged, so you can switch the filter off again and compare both views.
Behind the scenes, Page Analytics scans recent Google Analytics data and builds a bot profile for the site. The scan checks known fingerprints, such as impossible screen resolutions, and uses an AI classifier to review broader patterns across location, source, browser, operating system, language, referrer, and engagement.
Each signal gets a confidence level. Page Analytics uses suspicious signals to estimate likely bot traffic, but it only filters high-confidence signatures with near-zero false-positive risk. That is why the dashboard separates estimated bot traffic from filterable bot traffic.
Real traffic stays. High-confidence bot sessions are removed from Page Analytics reports.
Real and bot sessions mixed together.
Estimated: suspicious signals. Filtered: high-confidence only.
High-confidence bots removed. Uncertain traffic remains.
On your dashboard, you may see two bot traffic numbers. They measure different things:
Estimated bot traffic is how much of your traffic looks automated. It can include medium and low-confidence signals, such as suspicious location clusters or missing source data, when they help explain the bot pattern. These signals are useful, but not always safe to remove.
Filterable bot traffic is the share Page Analytics can remove from your reports with low false-positive risk. Only high-confidence signatures qualify. Known bot screen resolutions are the most common example; a high-confidence AI signature can qualify too.
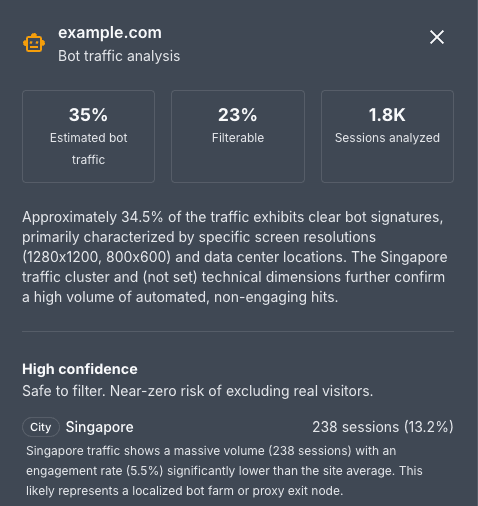
You may notice a gap between the two numbers. That gap is intentional. A site might show 35% estimated bot traffic but only 23% filterable. The remaining 12% looks suspicious but could include real visitors from unusual locations or devices. Page Analytics errs on the side of keeping real traffic in your reports rather than risking false positives.
If you want to check the raw signs yourself, start with the patterns below. Bot traffic usually stands out once you know where to look.
Start with screen resolution. Bots often run headless browsers at unusual or square resolutions like 1280x1200, 800x600, or 1024x1024, which real visitors almost never use. In Google Analytics, open Reports > Tech > Tech details and break it down by screen resolution.
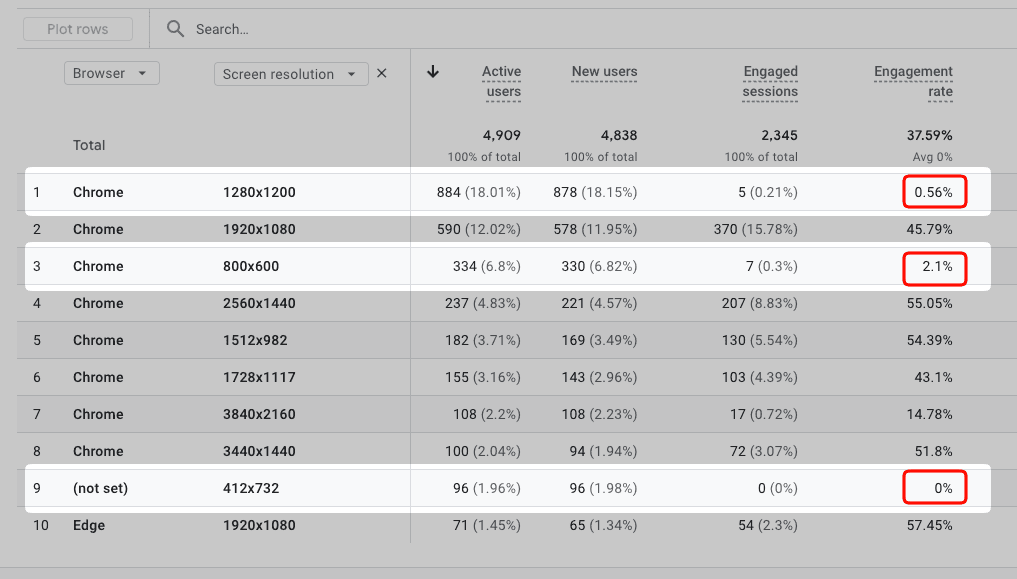
In this example, 1280x1200 has a 0.56% engagement rate, 800x600 has 2.1%, and 412x732 has 0%. The other resolutions on the same report mostly run 43-57%, which makes the highlighted rows strong bot signals.
Next, check whether one city or country sends a lot of traffic with little engagement. A city like Lanzhou can show up with hundreds of users and an engagement rate near zero. In Google Analytics, open Reports > User attributes > Demographic details, break it down by city or country, and scan the engagement rate column.
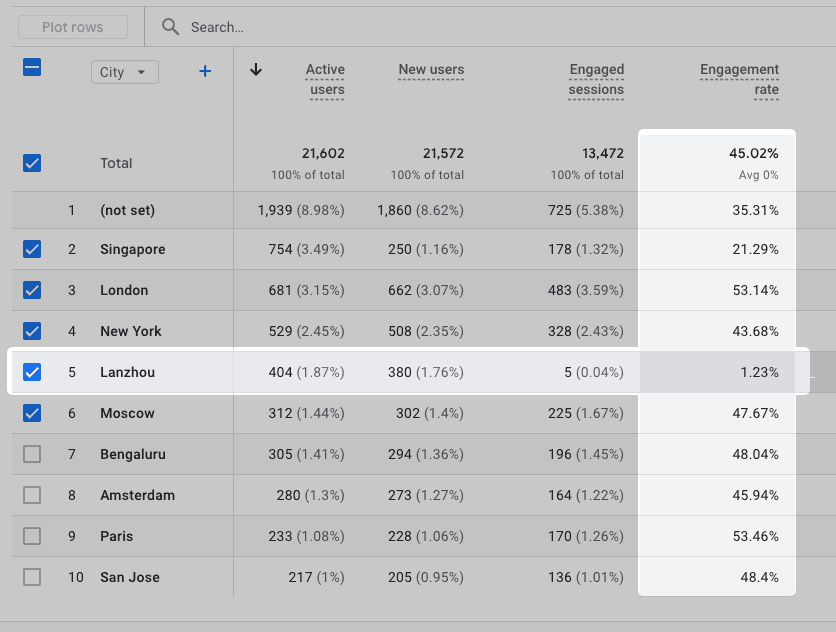
Here, Lanzhou shows 404 users but a 1.23% engagement rate, far below the 45% site average. Singapore also stands out at 21.29%. High-volume cities with almost no engagement are a common bot signature.
Screen resolution and location are two easy starting points. Any dimension, or combination of dimensions, can act as a bot signature as long as one value reliably maps to automated traffic. Traffic source, browser, operating system, language, and referrer are all worth checking too.
A signature is only worth acting on if it tracks a strong bot marker. Two markers do most of the work: known fingerprints like impossible screen resolutions, and near-zero engagement. Engagement is usually the strongest tell, since bots rarely do enough on a page to count as engaged. When a sharp engagement drop lines up with one dimension value, or a narrow combination, you've probably found a bot cluster.
Once you have a few reliable signatures, the natural next step is to keep that traffic out of your reports. Google Analytics can't do that: its data filters don't support screen resolution, city, or any other dimension you'd use to catch bots.
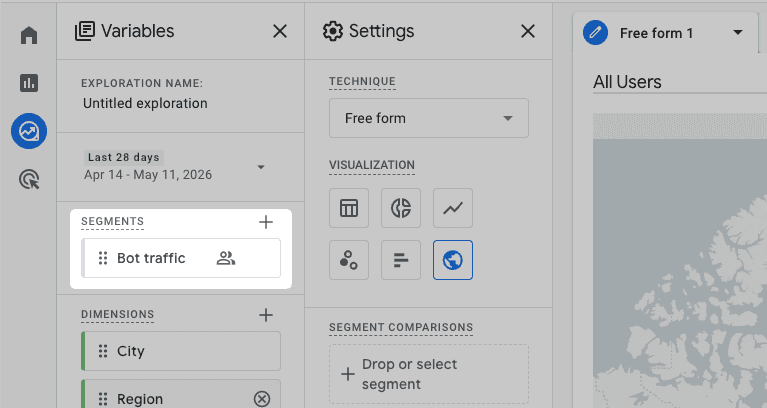
The official workaround is a segment in an exploration. Open Explore, create a segment, and add your bot conditions, like City exactly matches Lanzhou or Screen resolution exactly matches 800x600. With the conditions under Include users when, the segment isolates the bot traffic so you can see how much there is. The summary panel here shows 12.5% of users matched.
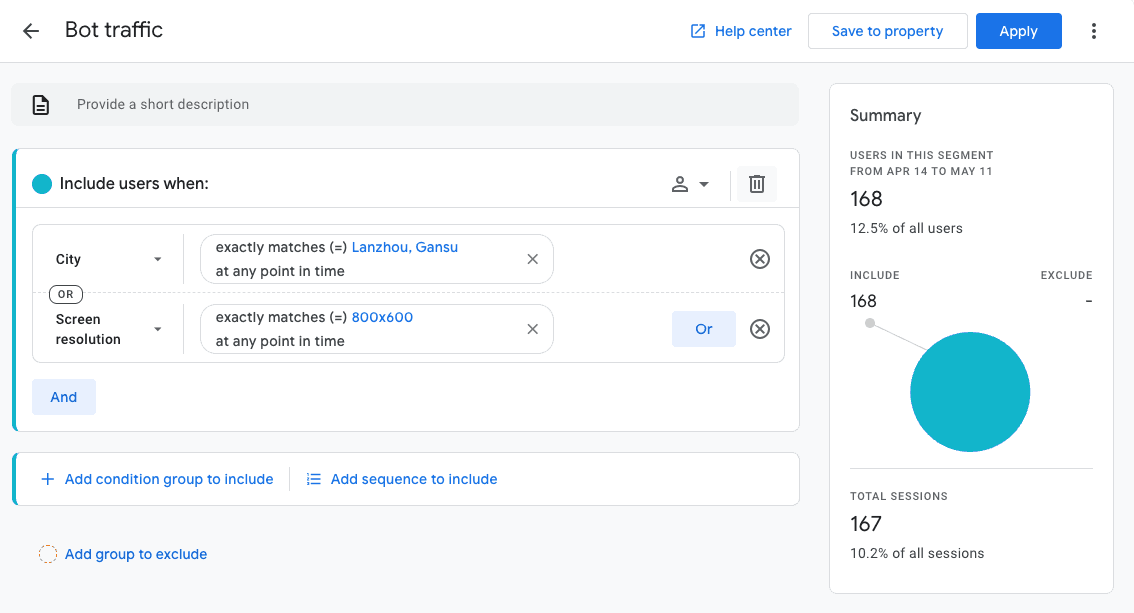
Click Save to property and the segment joins every exploration's segment list, so you build it once. To look at your data without the bots, put the same conditions under Add group to exclude instead.
For a one-off check, add a comparison with the same conditions to a standard report. Same idea, but it isn't saved.
If you don't want to maintain segments by hand, Page Analytics builds and updates a bot profile for each website, then lets you filter that traffic out with one toggle.
The profile shows estimated and filterable bot traffic, a summary of what the scan found, and the high-confidence signatures it can safely remove. In this example, a Singapore cluster of 238 sessions engages at 5.5%, far below the site average, so it reads as a likely bot farm or proxy exit node.
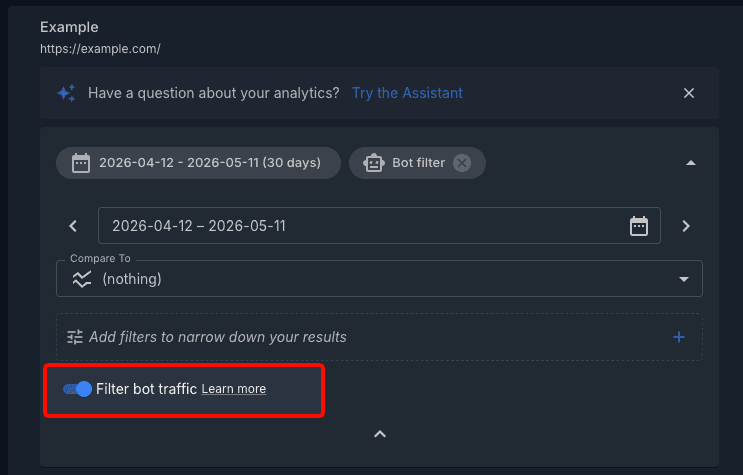
To use the profile, open a report for that site and turn on the Filter bot traffic toggle in the date and filters panel. A Bot filter chip appears while it's on, and the report drops the high-confidence bot sessions. Switch it off to compare the two views.
Behind the scenes, Page Analytics applies dimension filters to the Google Analytics data it pulls, excluding only the high-confidence signatures. The medium and low-confidence traffic stays, and your Google Analytics data is never changed.
As you review your data, you may see the same signatures across different websites:
Pattern | What it means | Confidence |
|---|---|---|
Screen resolution 1280x1200 | Not a real monitor resolution. Classic bot fingerprint. | High |
Screen resolution 800x600 | Outdated resolution rarely seen on real devices since 2010. | High |
Square resolutions (e.g., 1024x1024) | No mainstream monitors are square. Typically a bot or headless browser. | High |
City clusters with 0% engagement | Significant traffic from a city with no real interaction. | Medium |
Source "(not set)" with low engagement | No referrer and no engagement often means automated visits. | Low |
After you turn on bot filtering, your reports usually change in a few predictable ways:
Session and user counts may drop because bot sessions are excluded
Engagement rate often goes up because bot sessions usually have near-zero engagement
Geographic and source breakdowns should better reflect real visitors
Heatmaps and click data usually stay the same because bots rarely trigger real click events
Yes, but only some. Google Analytics excludes known bots and spiders based on the IAB bot list. Many bots mimic real browsers and still appear in your reports.
No. Page Analytics applies filters at the reporting level only. Your Google Analytics property keeps all data as-is, even when the filter is on.
Bot profiles are rebuilt monthly. Page Analytics also refreshes them when you add a new website or reconnect your account.
Page Analytics only filters high-confidence signatures. The excluded patterns, like screen resolution 1280x1200, have near-zero false-positive risk. If you're unsure, turn the filter off and compare both views.
