Page reports
A page report shows analytics for the pages on one of your sites, broken down page by page. You pick a website and a metric, and Page Analytics lists every page that has data for it, each with its total, a time-series chart, and a trend marker. The data combines Google Analytics 4 and Google Search Console.
Opening a page report
Go to Page Reports in the dashboard. Pick a website, then pick the metric you want. Page Analytics builds the report for that metric across the whole site.
If one hostname has several separately configured analytics sections, the website picker shows the website as a heading with its sections nested below it. Pick the section whose GA4 data you want to use. The picker hides low-traffic websites to keep the list focused, but configured sections always remain visible. See Choose the right GA4 property if your website needs this setup.

You can switch between metrics from the tabs at the top of a report. Metrics you don't have data for (for example Search Console metrics on a site you haven't connected to Search Console) are shown but disabled.
Metrics you can report on
From Google Analytics 4:
- Page views
- Users
- Conversions
- Page value
- File downloads
From Google Search Console:
- Search clicks
- Search impressions
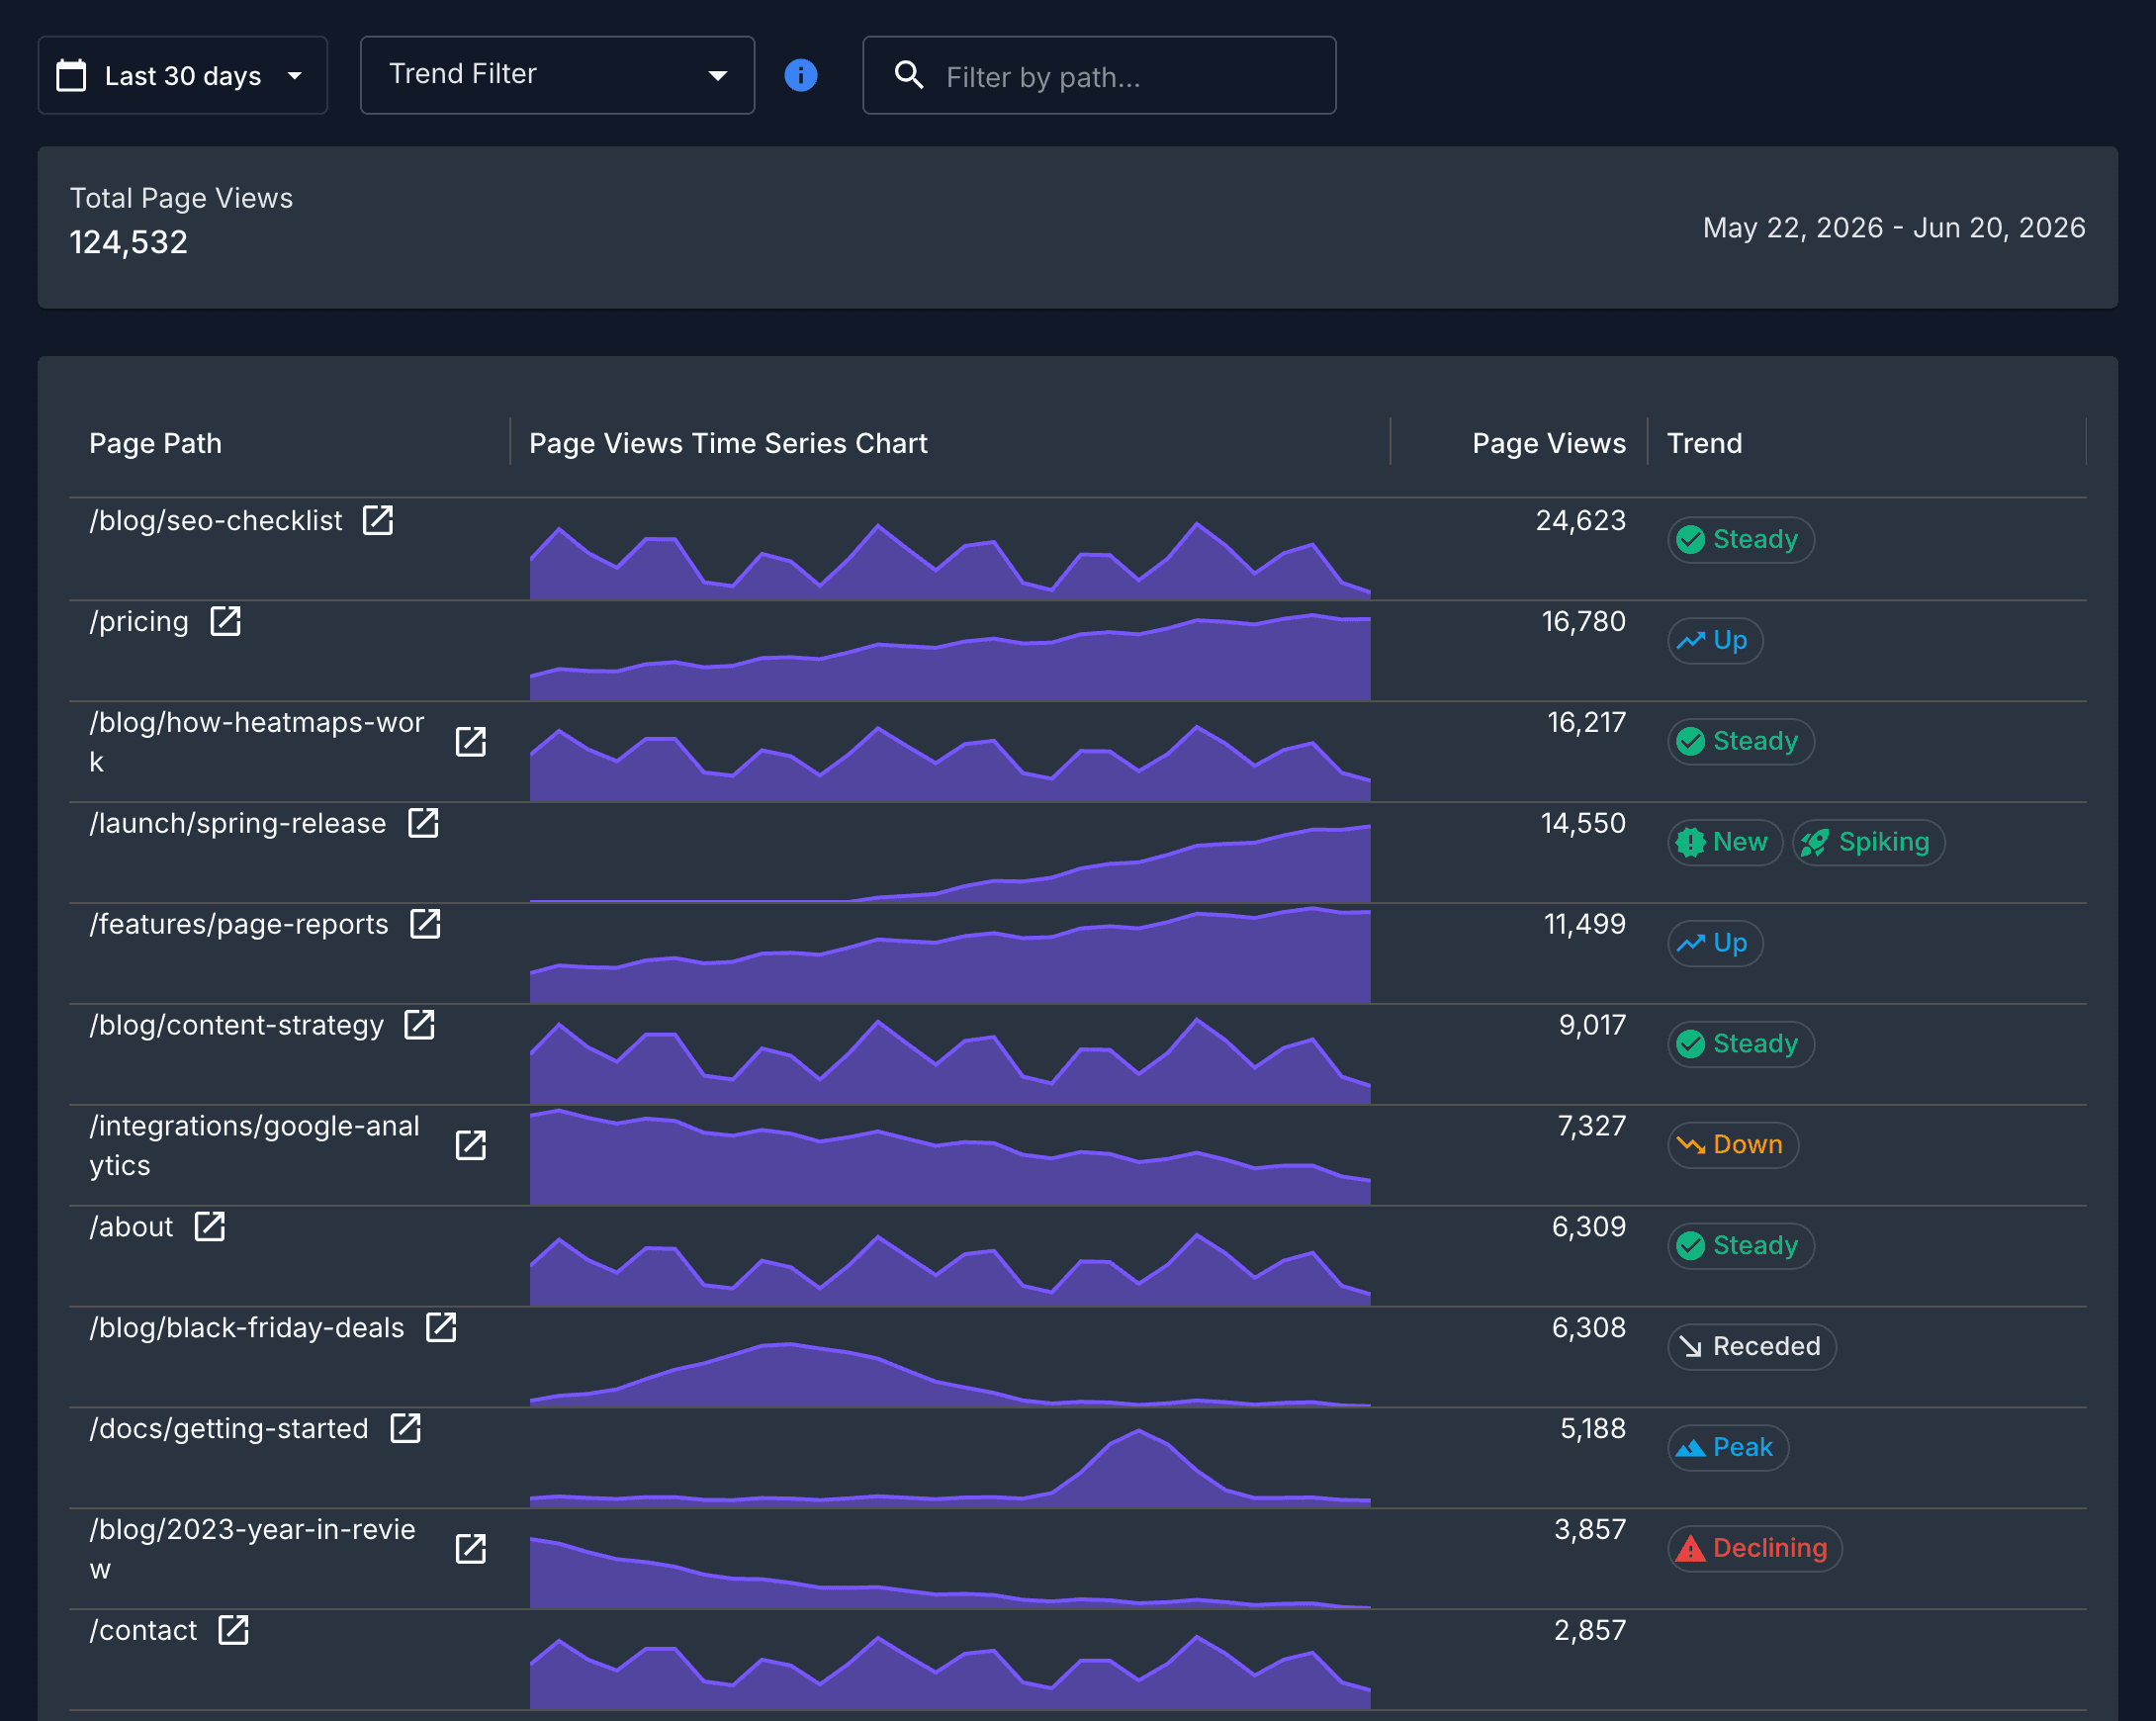
What a report shows
Each report is a table of pages, sorted by the metric you chose. For every page you get:
- The page path, with a link to open the live page.
- A time-series chart of the metric over the selected date range, so you can see the shape of the trend over time.
- The total value of the metric for that page.
- Trend markers, based on how the page's numbers move over the period. A page can carry more than one: steady, up, down, new, spiking, peak, receded, or declining. Pages with no clear pattern are left unmarked.
Above the table you get the site-wide total for the metric and the date range the report covers.
The trend markers mean:
| Marker | Meaning |
|---|---|
| Steady | Consistently strong traffic with no major swings |
| Up | A steady, sustained climb over the period |
| Down | A steady, sustained decline over the period |
| New | A page that started getting traffic partway through the period and is still active |
| Spiking | Recent days surged well above the page's usual level and are staying high |
| Peak | A short, isolated burst on an otherwise quiet page |
| Receded | Traffic spiked and has fallen back toward its baseline, often a campaign that ended |
| Declining | Traffic has faded to near zero |
See how Page Reports detect trends for a plain-English explanation of the labels, their thresholds, and the statistics behind them.
Date range and comparisons
You set the date range with the date picker at the top of the report. The charts and totals update to match. Reports default to the last 30 days.
Filtering and search
Use the trend filter to show only pages with the trends you care about, like new pages gaining traction or pages that are declining. Pick more than one to widen the list. Next to it, the path filter narrows the table to pages whose path contains what you type, so you can jump to a section like /blog or a single page. The table updates as you type. A button next to the filters exports the report to CSV.
Going deeper on a single page
The page report gives you the per-page view across your whole site. To dig into one URL on its own, open that page on your site with the extension and use the in-page report. The sidebar shows that page's traffic sources, inbound and outbound link clicks, and Search Console queries in place. You can open a page directly into this view from the link next to its path in the report table.
Ask in plain language
If you'd rather ask a question than read a table ("which pages lost the most traffic last month?"), the AI assistant answers in plain language and returns its own charts and tables built from the same GA4 and Search Console data.