
AI analytics assistant
Ask a question about your website in plain language and get back a report. The assistant pulls from your Google Analytics 4 and Google Search Console data and answers with charts, tables, and a short written summary instead of raw numbers.
You need a connected website with GA4 or Search Console before you can ask anything.
What the assistant does
You type a question the way you'd ask a colleague, and the assistant builds a structured report to answer it. A report can include trend lines, period comparisons, bar charts, distribution charts, country and region maps, data tables, and metric cards with a percentage change. The assistant also writes a few sentences explaining what the data shows.
Reports read from:
- Google Analytics 4 for traffic, users, engagement, and conversions
- Google Search Console for search keywords, impressions, and clicks
These are the same page reports building blocks you see elsewhere in Page Analytics, assembled to fit your question.
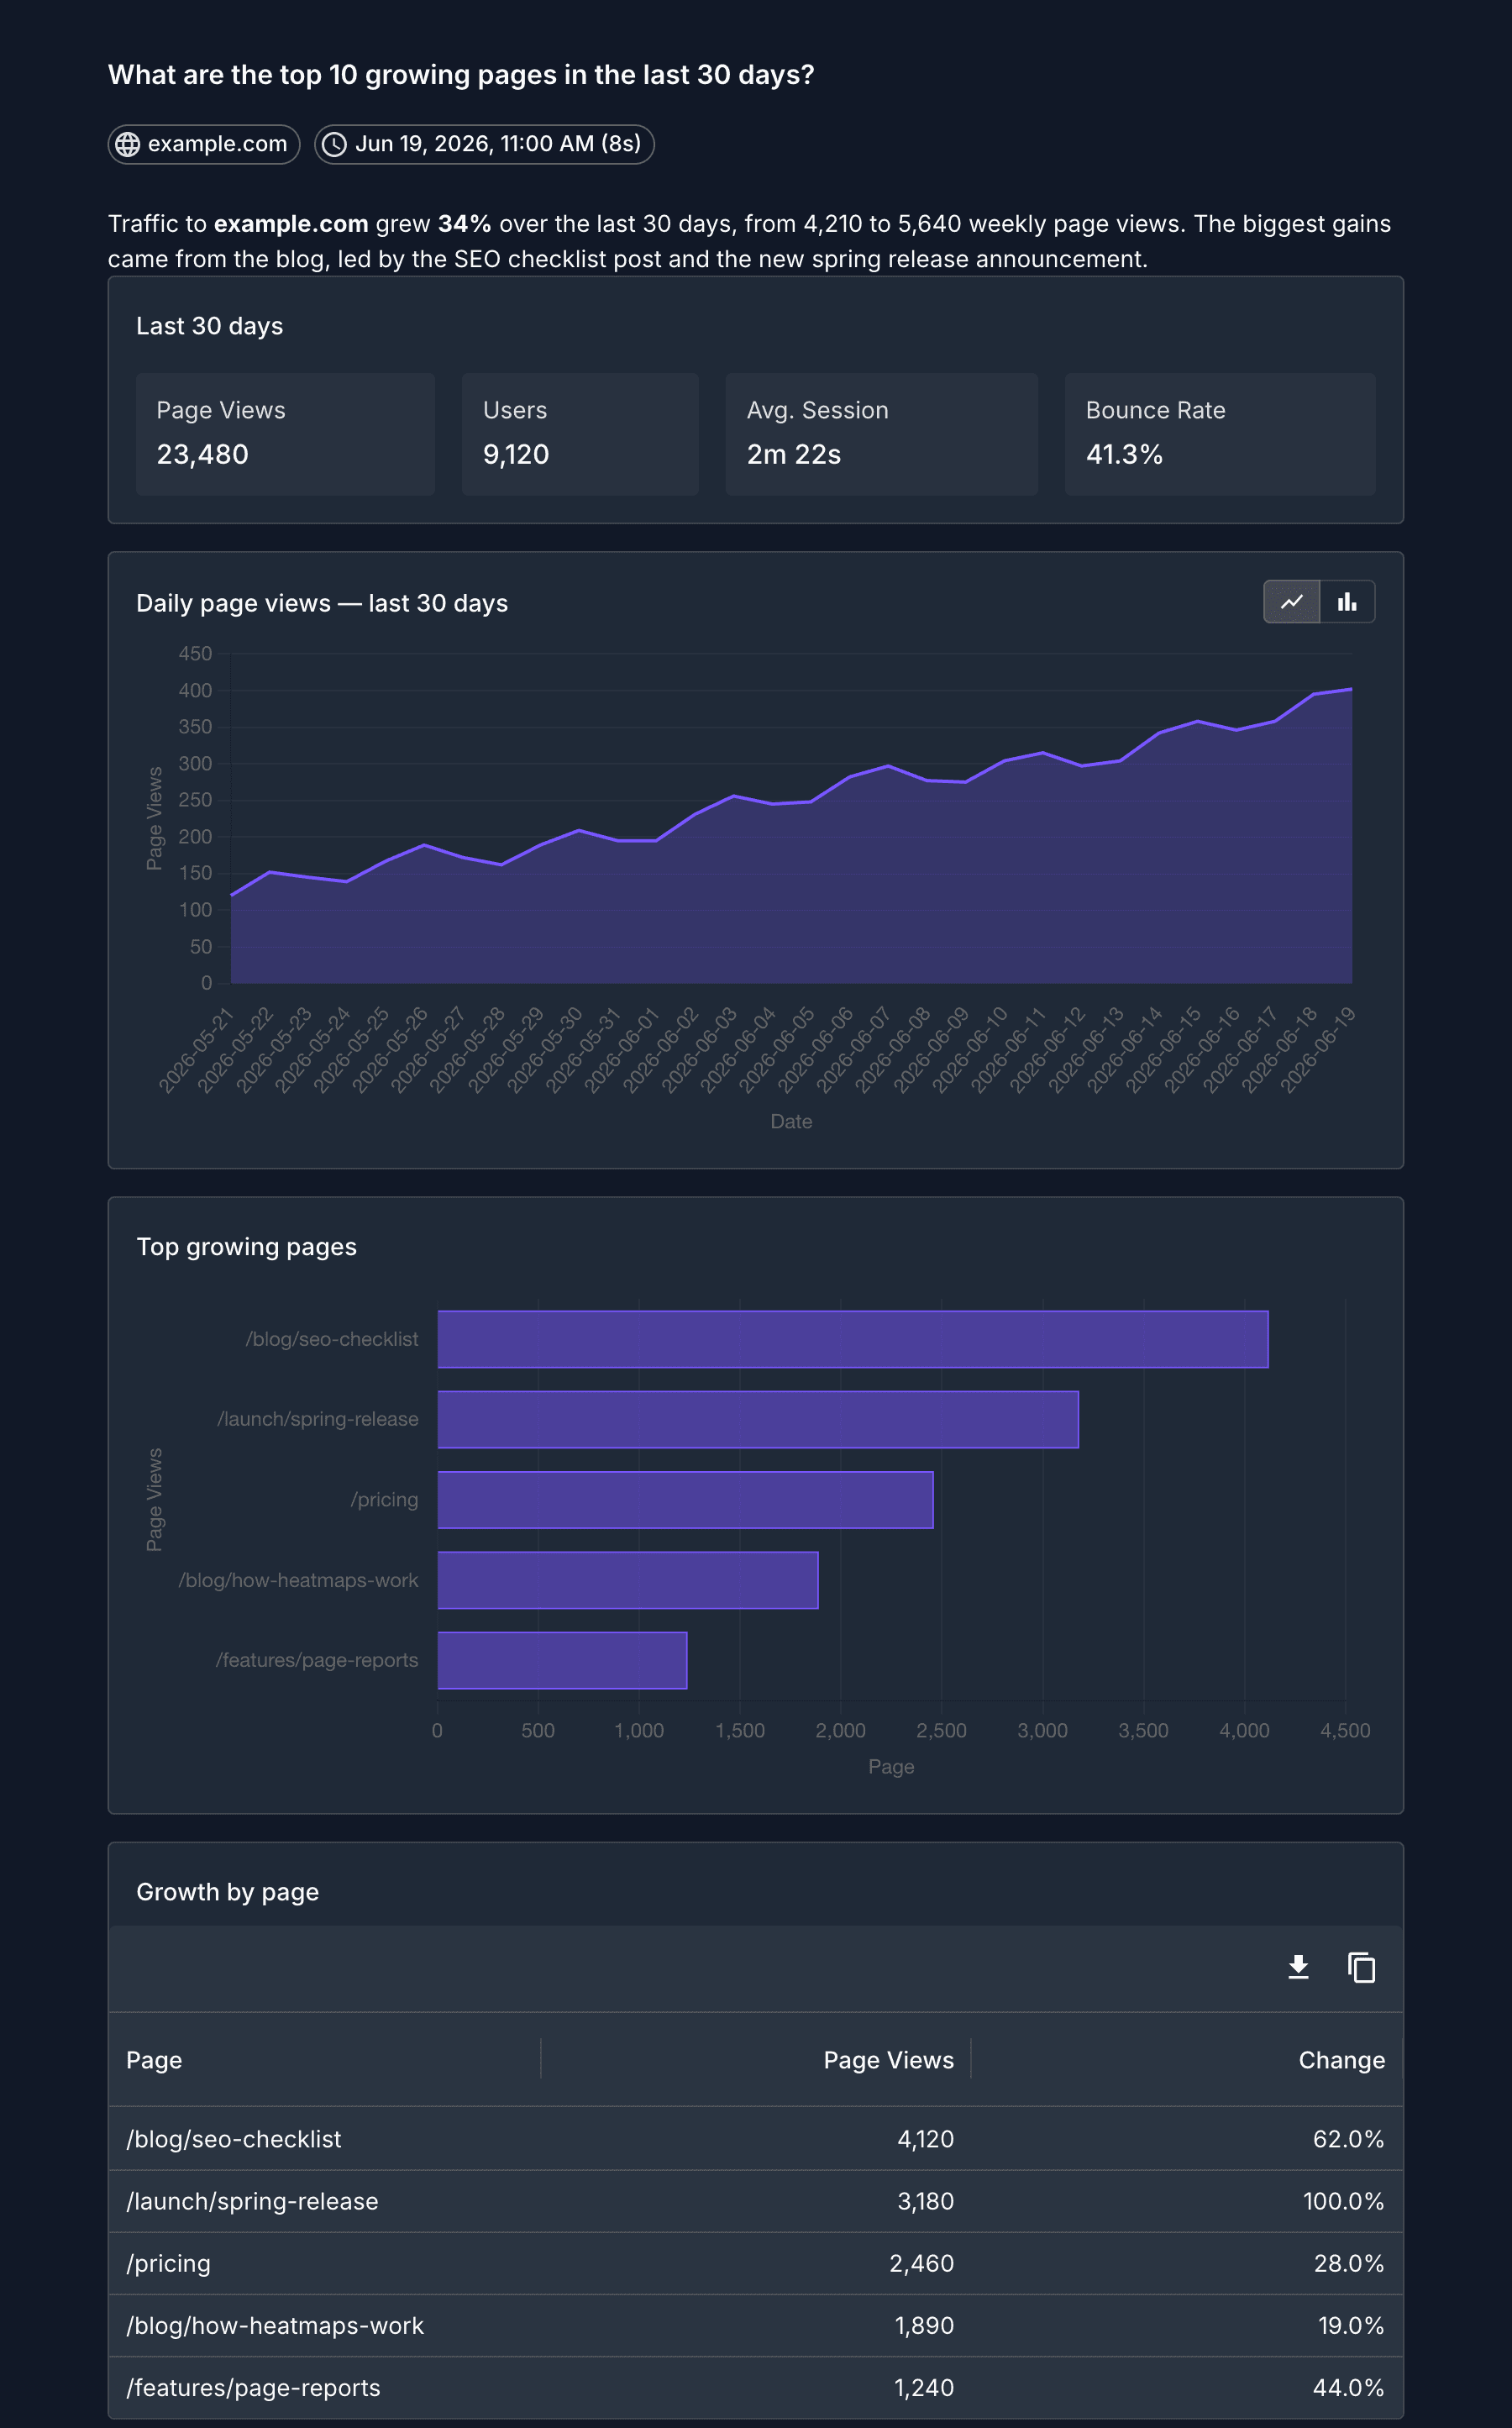
Ask a question
Open the assistant from the dashboard. To create a report:
- Pick the website you want to analyze.
- Type your question in the box, for example "What are the top 10 growing pages in the last 30 days?"
- Submit the question.
If the same hostname has several separately configured analytics sections, each one appears beneath a shared website heading in the picker. The assistant keeps that selection for the entire report, so every GA4 query uses the same data source. The picker hides low-traffic websites, while configured sections always remain visible. See Choose the right GA4 property if your website needs this setup.
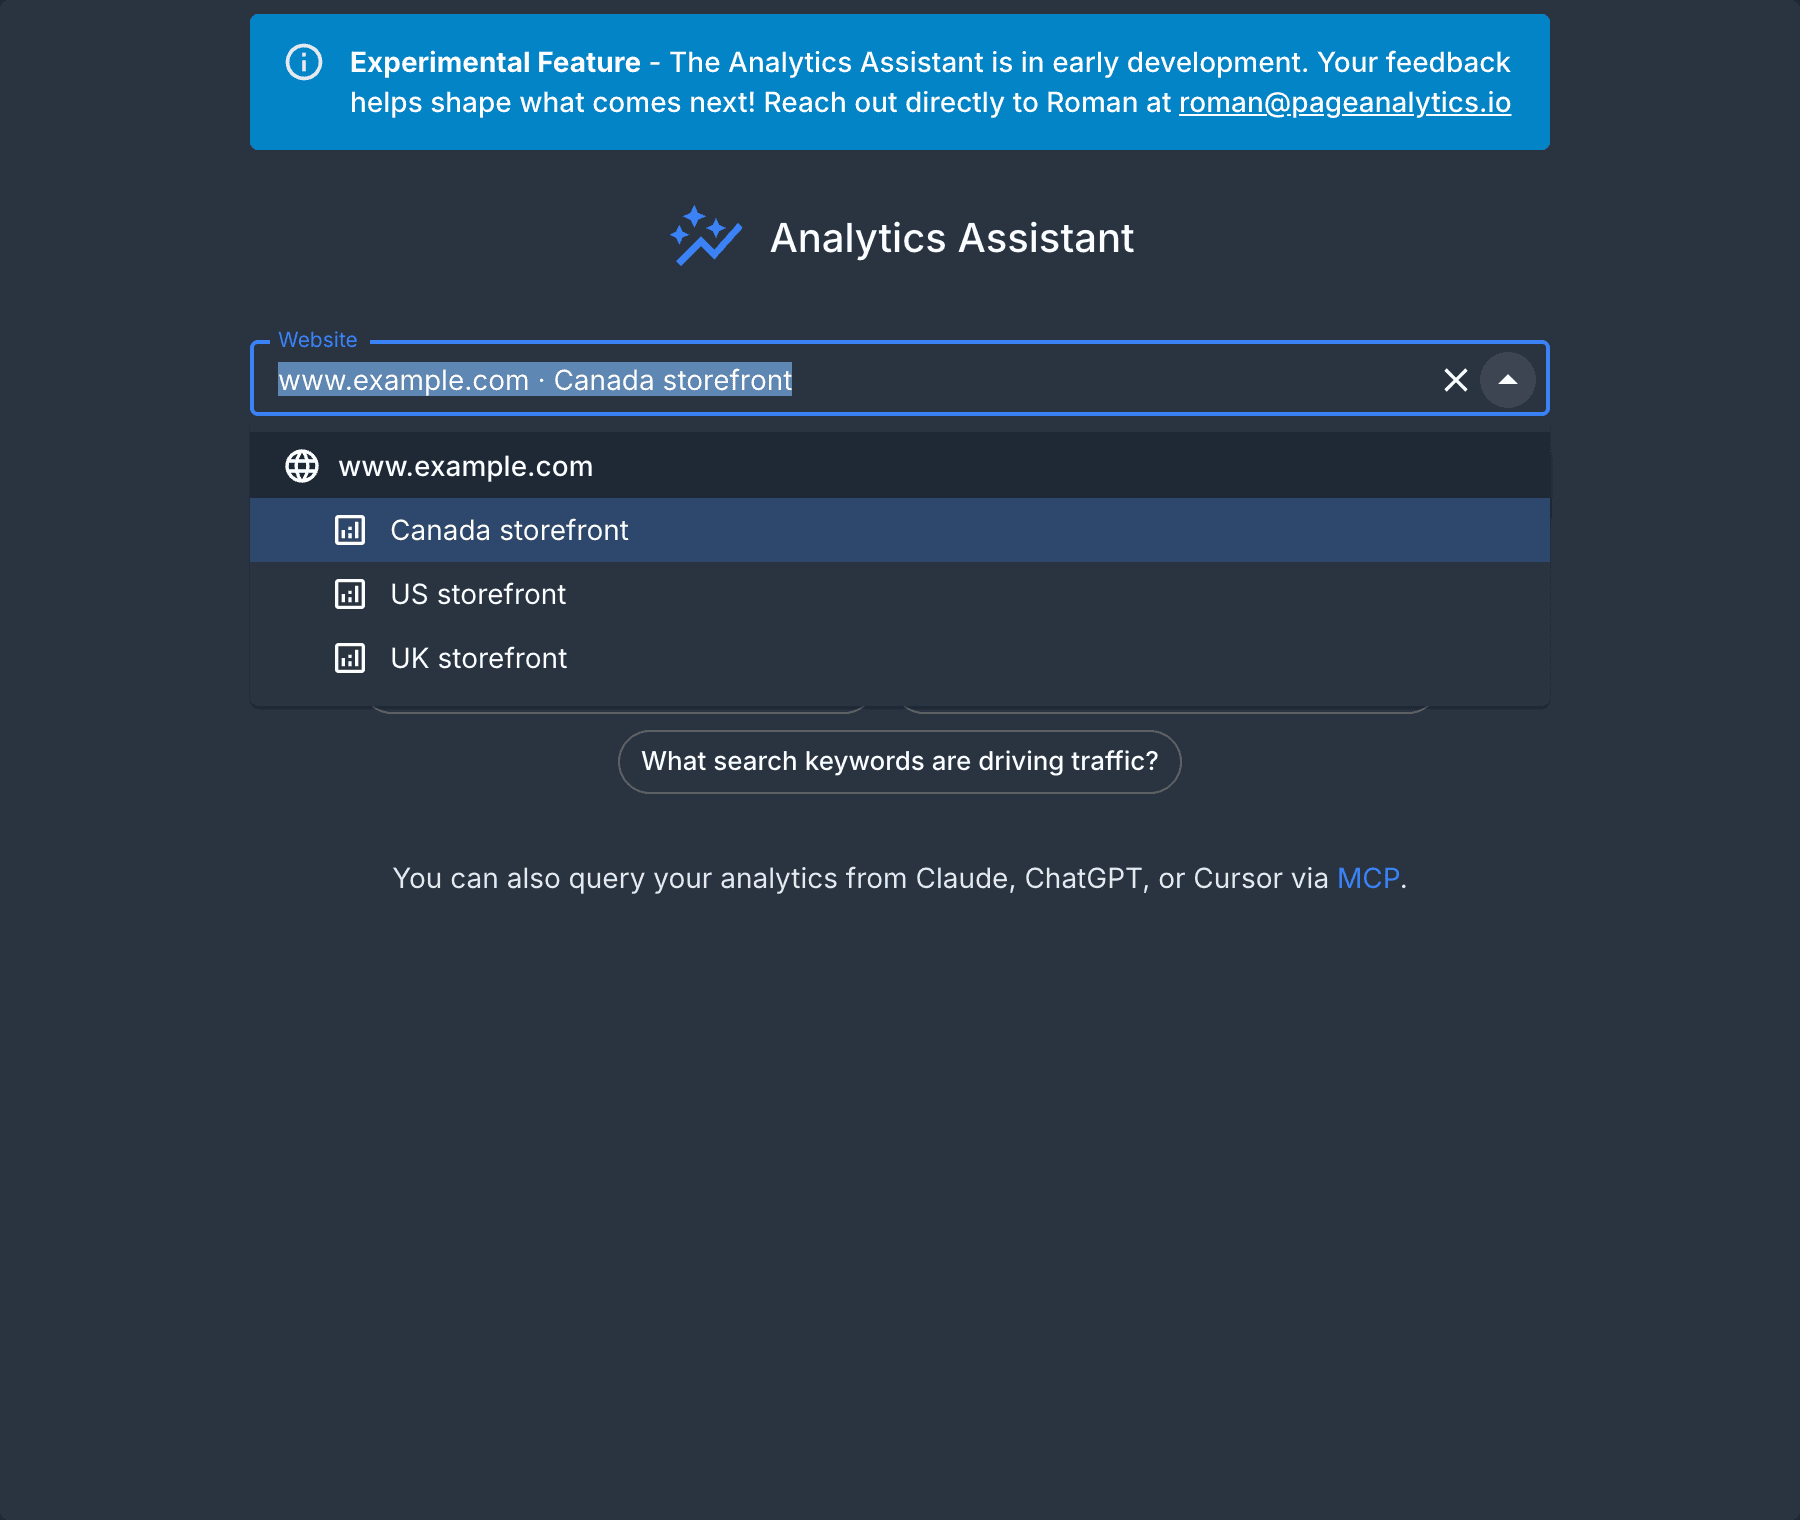
The report starts generating right away and shows up in your history while it runs. It takes a few seconds to finish.
If you're not sure what to ask, the assistant shows a few example questions you can click to fill in the box, then edit before you send. They cover common things like fastest growing pages, where traffic comes from, year over year comparisons, top countries, and the search keywords driving traffic.
Ask for changes
A finished report has a box under it for asking for a change: "exclude direct traffic", "break it down by month", "only look at the last 7 days". The assistant answers with a new version of the same report, so your history stays one entry per question instead of filling up with near-duplicates.
Press ⌘Enter (Ctrl+Enter on Windows and Linux) to send without reaching for the button. Plain Enter starts a new line, so a longer request doesn't submit halfway through. The same shortcut works in the box where you ask a new question.
Each change is answered from scratch. The assistant re-runs its queries against current data rather than editing the text it wrote last time, so the numbers you see are the numbers it just fetched. Changes also stack: if you asked it to exclude direct traffic and then ask for a different date range, direct traffic stays excluded.
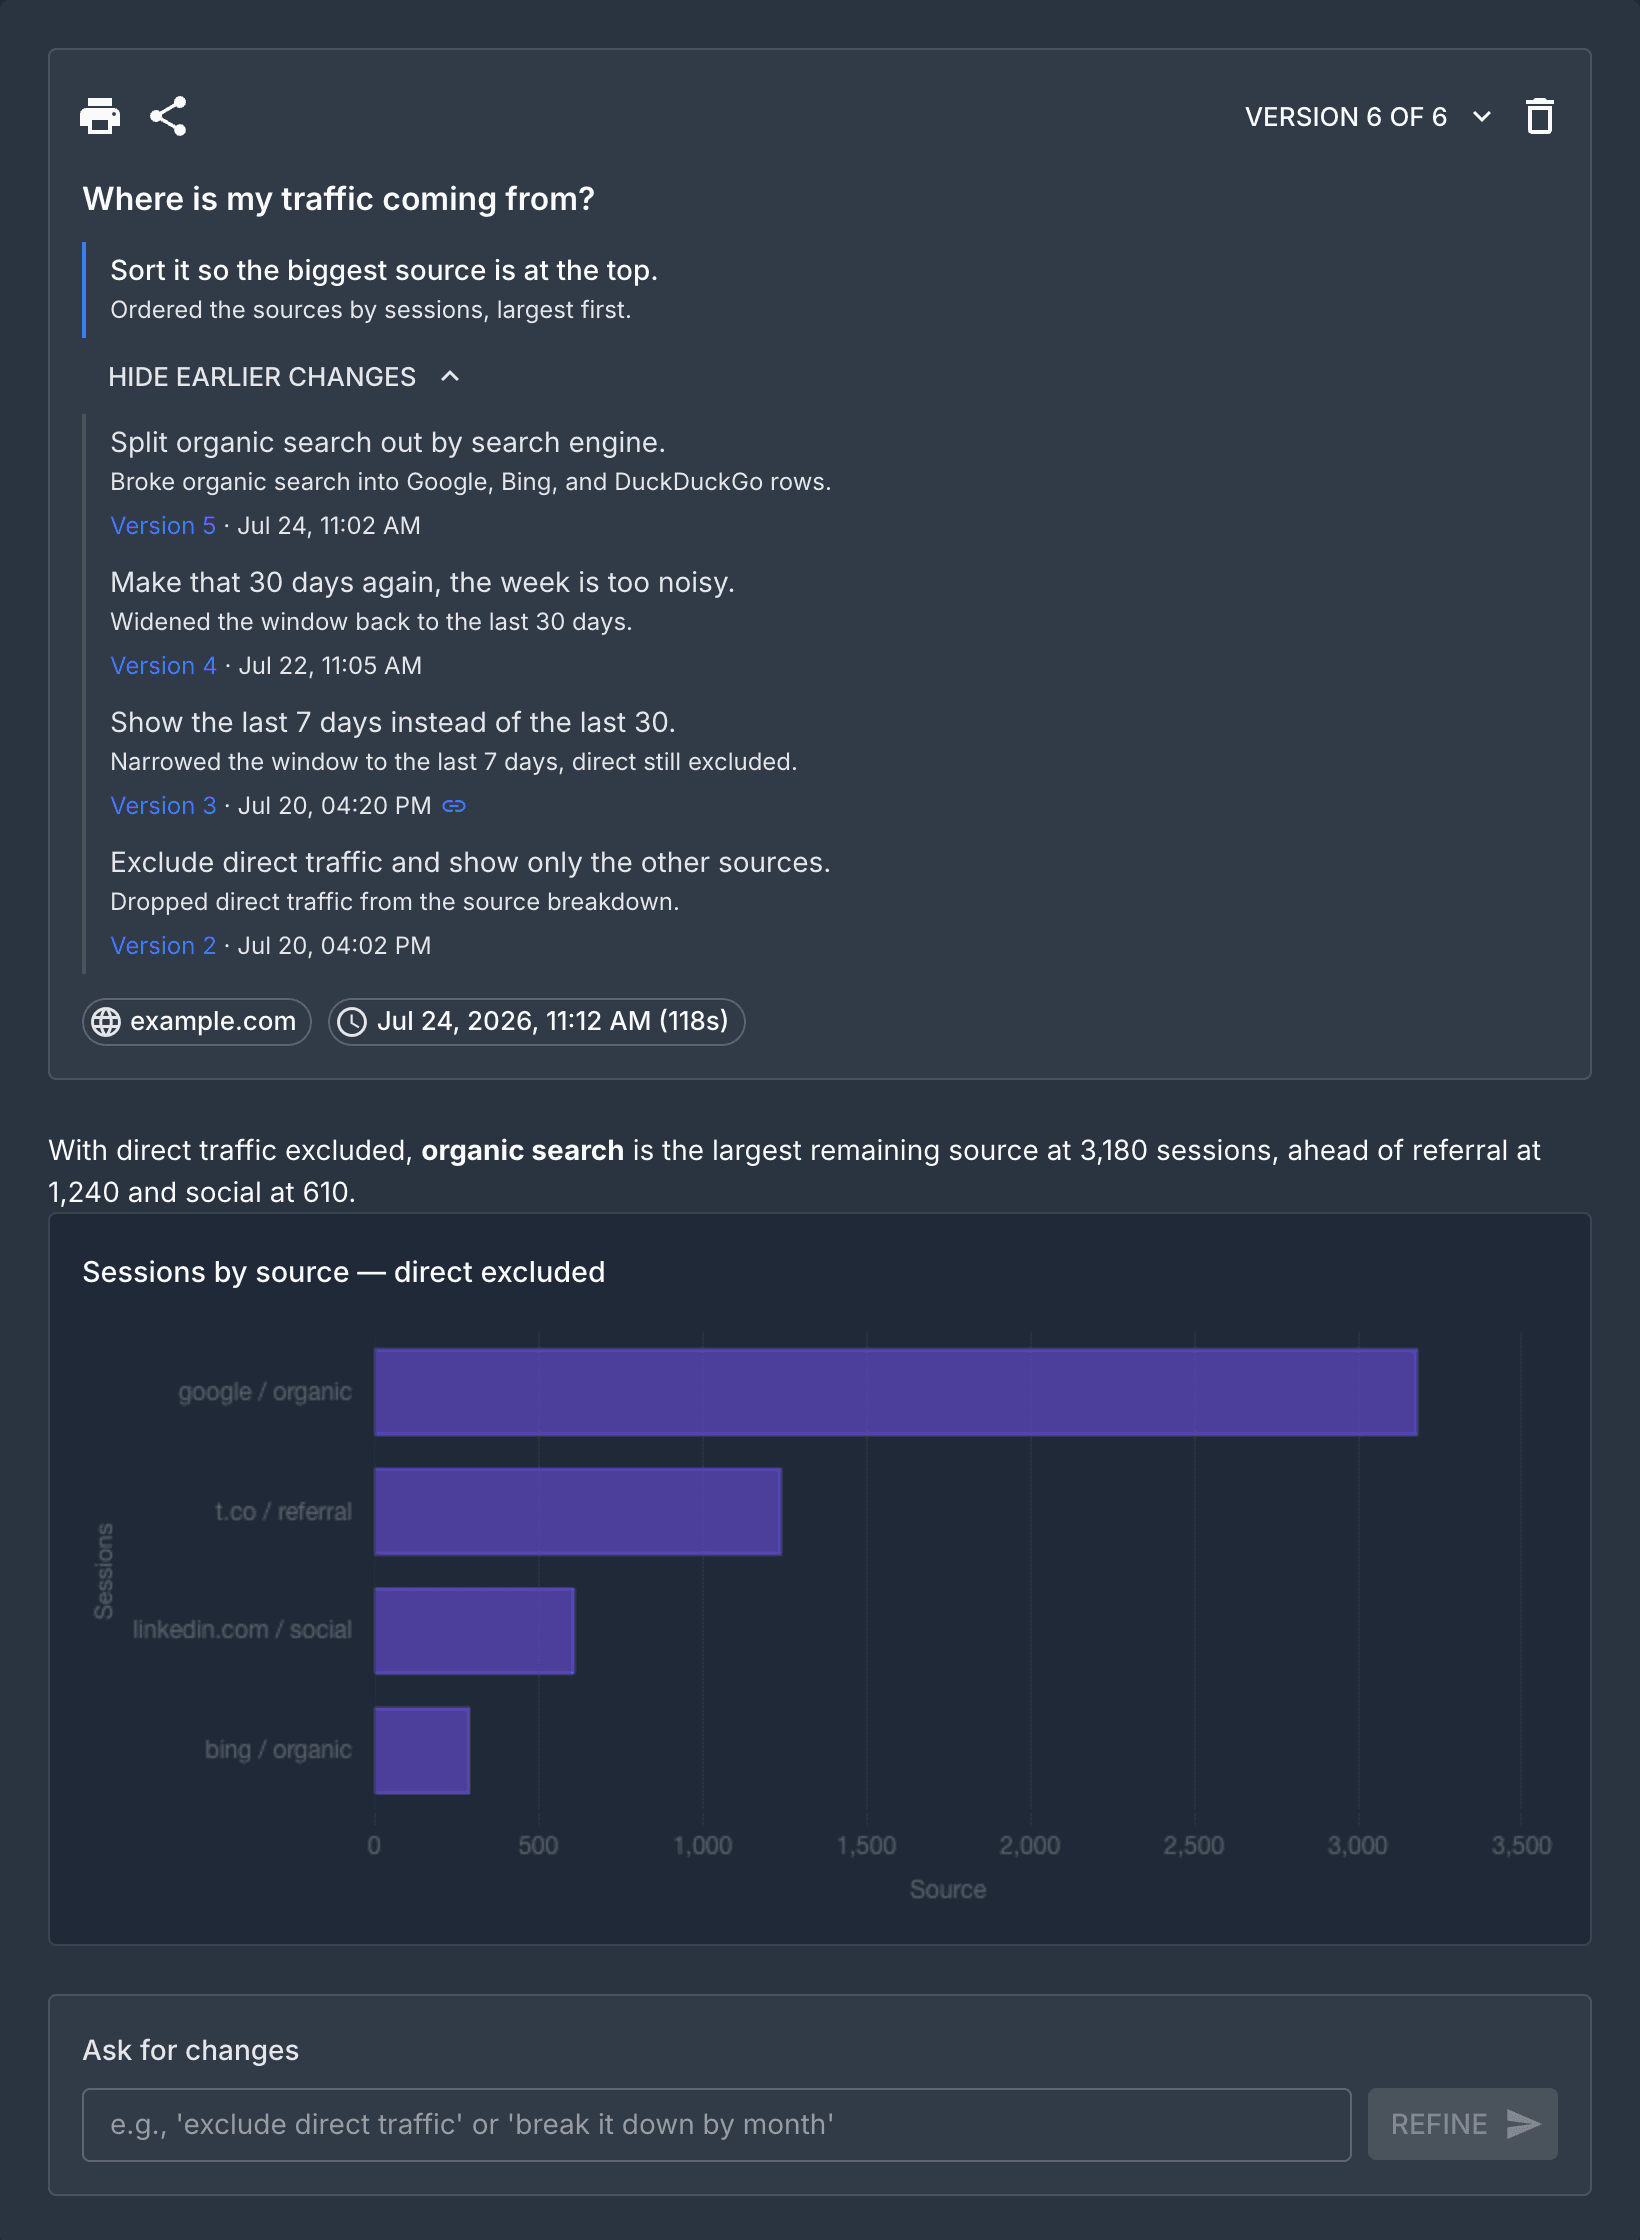
Everything that is not the report itself sits in the panel above it: the question, the changes you asked for, and the controls. The analysis starts below.
Directly under the question is the change you last asked for, with a line from the assistant on what it did differently. Earlier changes sit behind a toggle, newest first; open it to read the run of requests that led to what's on screen. Each one is dated and links to the version it produced, which matters when you come back to a report days later.
Use the version menu in the top corner to move between versions. Each entry is labeled with the change it answered, so you can pick one by what you asked rather than by timestamp. Older versions stay readable, so you can go back and compare what an earlier answer said. You can keep refining a report up to ten times; after that, start a new one.
You can ask for a change only on the newest version, and only once the report has finished. If you have the report open in two tabs and refine it in one, the other tells you the report has moved on and offers to open the current version. It keeps what you typed and never submits it against a different analysis.
Report history
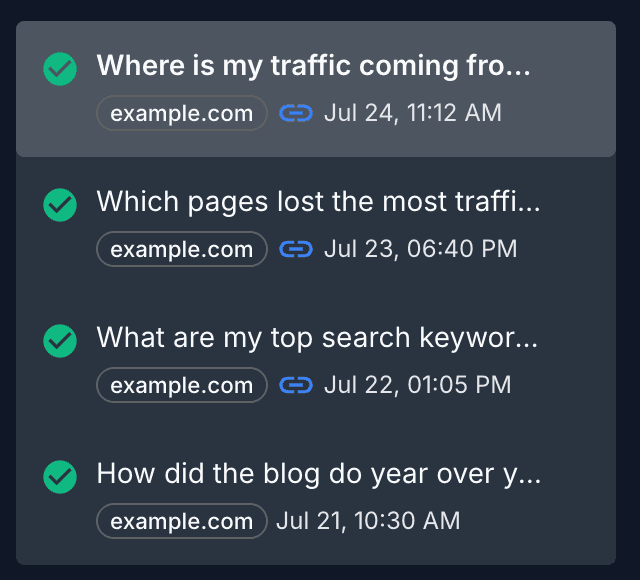
Your past reports are listed alongside the assistant. Each entry shows the question you asked, the website it ran against, when it was last worked on, and its status (still running, finished, or failed). Click any report to open its latest results again.
Deleting a report removes every version of it, not just the latest, and any public link you created stops working. The confirmation says how many versions and links go with it.
Share a report
You can publish a report as a public link so anyone can view it without signing in to Page Analytics.
Open a report and choose to share it. The assistant generates a link you can copy. Anyone with the link sees the same charts and tables, but nothing else from your account.
A link points at the exact version you shared, and the dialog names which one before you create it. Recipients get that version and nothing else: not the report's other versions, and not the changes you asked for along the way. If you refine the report afterwards, they keep seeing what you sent them rather than the newer answer.
To share a newer answer, open that version and share it too, because sharing one version says nothing about the others.
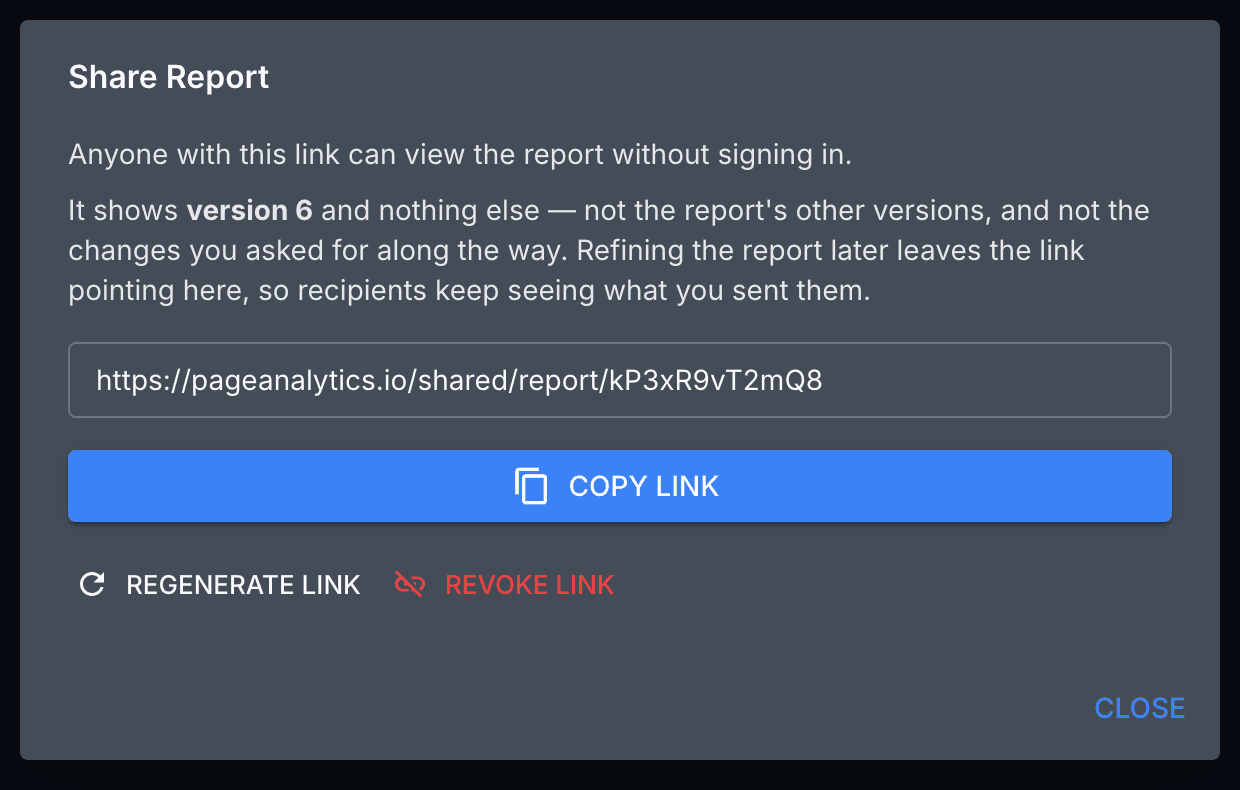
You stay in control of the link:
- Regenerate creates a fresh link and immediately breaks the old one. Use this if a link was shared too widely.
- Revoke turns off sharing entirely, so the link stops working.
A link icon in your history means some version of that report is shared, which is not necessarily the one you open. Hover it to see how many. To find which, open the report and look at the version menu: the shared versions carry the same icon, as do the changes listed under the question.
Limits
There's a cap on how many reports you can generate in a rolling time window. Asking for a change counts the same as asking a new question, because it runs the same analysis work. When you hit it, the assistant tells you the limit is reached and when you'll be able to run new reports again. The window rolls forward, so a slot frees up as your oldest reports age out.
If you need a higher limit, reach out to roman@pageanalytics.io.
Connect AI tools instead
If you'd rather query the same GA4 and Search Console data from Claude, ChatGPT, or Cursor, you can connect those tools directly. See Connect AI tools with MCP.