
Your Google Analytics data
Once Google Analytics 4 is connected, Page Analytics shows each page's traffic, sources, and engagement right where the page lives. It's the data source behind every in-page report.
GA4 connects through the same Google sign-in as the extension. See Install the extension for the sign-in and permission steps.
What GA4 data you see
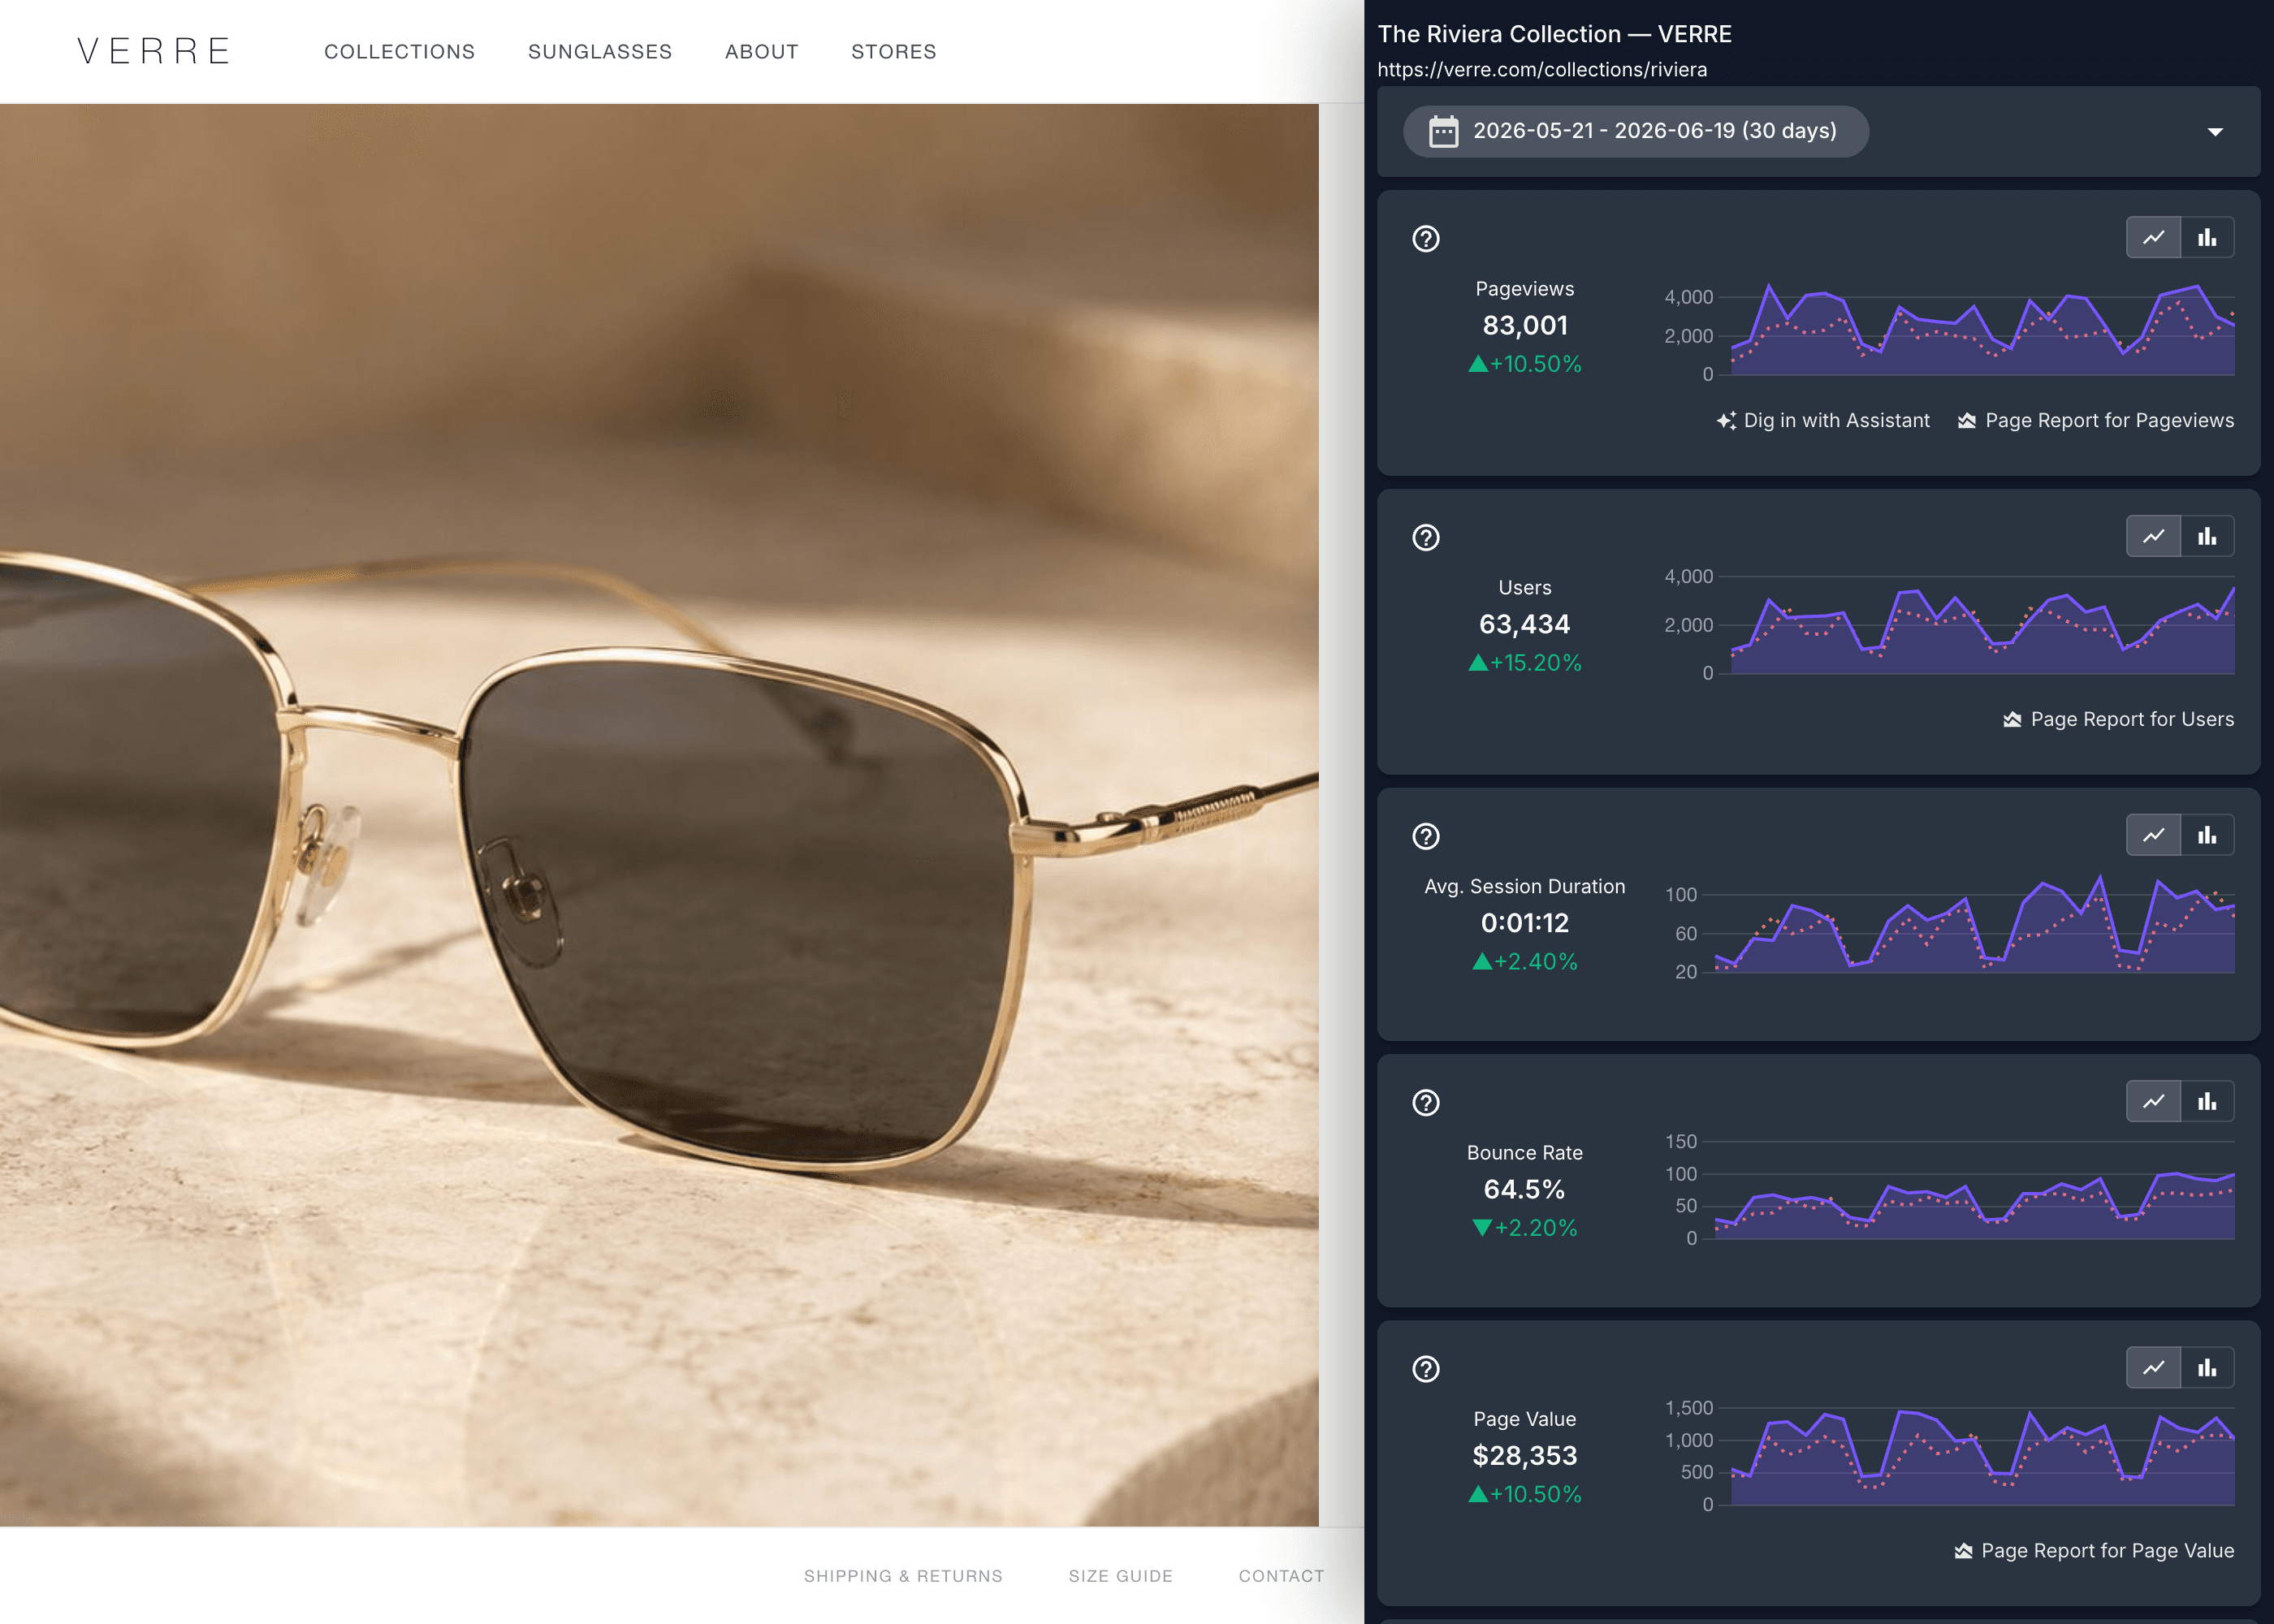
Page Analytics reads your GA4 metrics for the exact page you are viewing. The in-page report and the dashboard reports cover:
- Page Views and Users for the page.
- Avg. Session Duration and Bounce Rate for engagement.
- Conversions and Conversion Rate (GA4 key events).
- Page Value in your property's currency.
- Tracked events, such as file downloads.
- Traffic sources, broken down by source, medium, and channel (for example Organic Search, Paid Search, Direct, or referral).
You can also break data down by country, device, new vs. returning visitors, and over time, and set the date range on each report.
How the property is matched
After GA4 is connected, click Fetch My Websites on the dashboard to pull in the sites you have access to. Each website appears as a card showing its domain, the connected GA4 account and property, and roughly how much weekly traffic it gets.
Page Analytics maps each website to the GA4 property that has data for that domain. When a domain has data in more than one property, it uses the property with the most traffic by default. If it chooses the wrong property, or different properties cover different parts of your website, see Choose the right GA4 property.
If you cleared the Analytics permission during sign-in, the dashboard prompts you to fix it with Sign In to Update Permissions.
Check the property used for a page
The data source row near the top of the sidebar names the GA4 property used for the page you are viewing. If the page matches a configured analytics scope, the row also shows its scope label. Open the row to see the GA4 account and property names and IDs, or use Open in GA4 to open the property in a new tab.
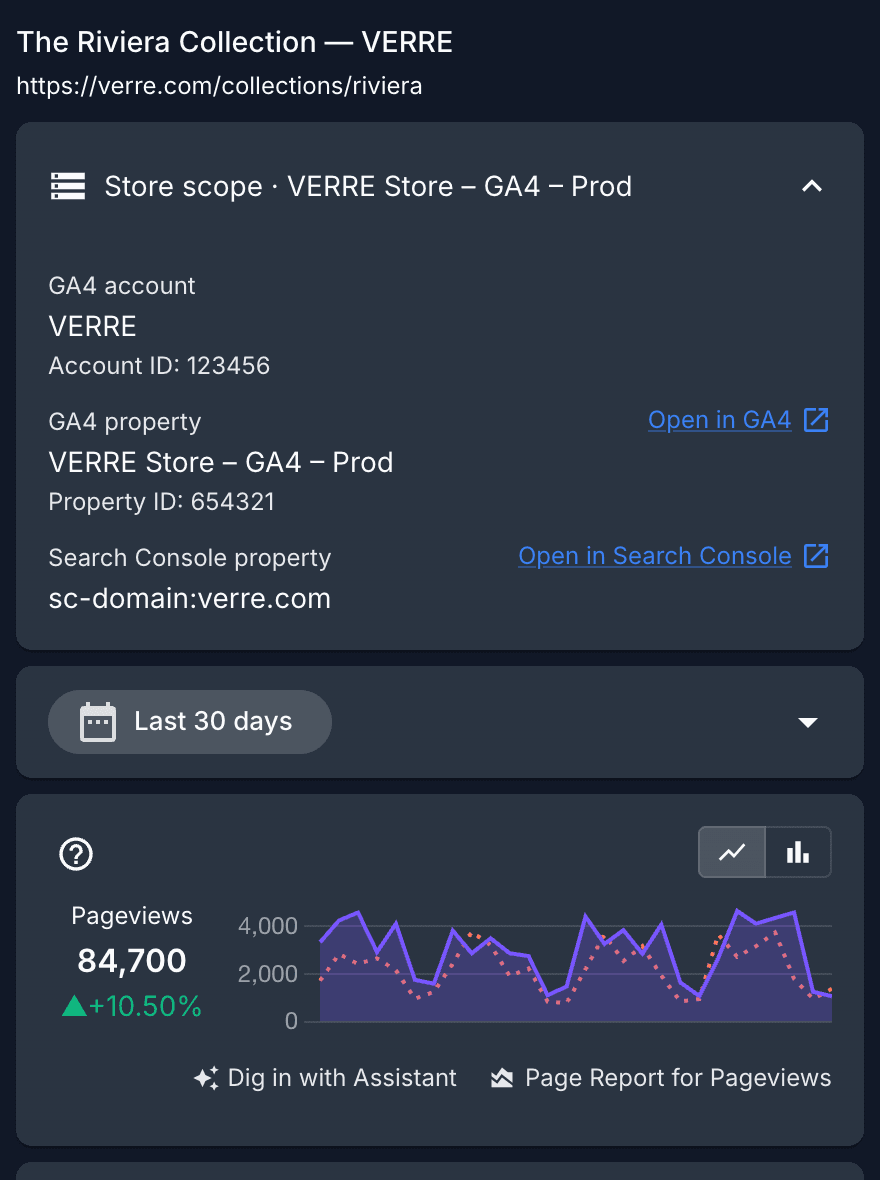
When no analytics scope is configured, Page Analytics selects the property automatically and shows its name without a scope label.
Where it shows up
- The extension popup and sidebar. Open the toolbar popup or the in-page sidebar to read the GA4 report for the page you are on. See Use the sidebar.
- The dashboard. Open a website's report from its card for the full page-by-page view, charts, and source breakdowns.
Next steps
- Add your Search Console data to see search queries and indexing status.
- Use the sidebar to read GA4 data in place on any page.