Page Analytics sidebar
The Page Analytics sidebar shows your traffic and visitor data on your own pages, so you read your analytics while you browse instead of switching to a separate tab.
What the sidebar shows
The sidebar overlays your analytics in the browser. You see key metrics, charts, and visitor behavior for the page you're on, updated as you move around your site.

Open the sidebar
After you install the Page Analytics extension and sign in, a "PA" button appears on the right edge of your site. Click it to open the sidebar.
- Install the Page Analytics extension from the Chrome Web Store.
- Sign in with your Google Analytics account.
- Visit your website to see the "PA" button.
- Click the button to open the sidebar.
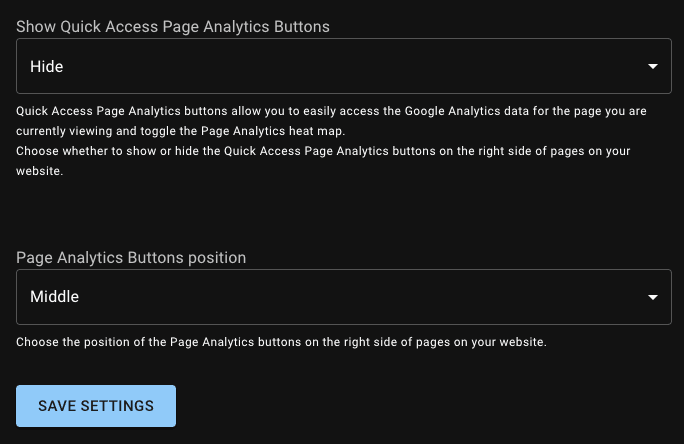
Customize the button
Set where the button sits and when it shows up from your settings page. Use the Button Position menu to place it along the right edge, and the Button Visibility menu to choose which sites show it.
Adjust the data you see
The sidebar's collapsible settings section lets you change the date range, compare periods, and filter the data.
Check the data source
The data source row near the top of the sidebar shows which GA4 property supplies the report. If you configured different GA4 properties for parts of one website, it also shows the analytics scope selected for the page's full URL.
Open the row to see the GA4 account and property names and IDs. If Search Console is connected, you also see the exact Search Console property matched to the page. Open in GA4 and Open in Search Console take you to those resources in a new tab.

When Page Analytics selects a property automatically, the row shows the GA4 property name without calling it a scope.
Where report data comes from
Traffic and visitor data come from your Google Analytics account. Search query data comes from Google Search Console.